Dashboard
The dashboard is the analyst-facing surface of the platform. It turns endpoint telemetry, rule matches, enrichment, and AI reasoning into one investigation workspace where a reviewer can move from "what happened?" to "what should I do next?" without opening multiple tools.
What the console demonstrates
The console is useful for documentation and interviews because it shows the complete product loop, not only isolated backend code:
- Endpoint detections arrive from the Windows agent into the cloud backend
- Events are searchable, filterable, and triaged with handled/unhandled lifecycle controls
- Each alert opens into raw evidence, process lineage, VirusTotal context, and AI analysis
- Multiple alerts can be selected and correlated into a possible campaign or attack chain
- Agents, rules, users, cloud connections, and login activity are visible from the same application
Live console areas
| Area | What it shows |
|---|---|
| Overview | SOC metrics, severity breakdown, recent activity, and agent health |
| Events | Detection table with search, filters, bulk actions, details, and correlation |
| Event Details | Raw event metadata, process information, process tree, AI analysis, and follow-up chat |
| Agents | Registered endpoint inventory, status, heartbeat, active rules, and OS information |
| Rules | MITRE-style category list and editable JSON rule definitions |
| Administrator | User management, AWS connection health, and login audit trail |
Dashboard overview
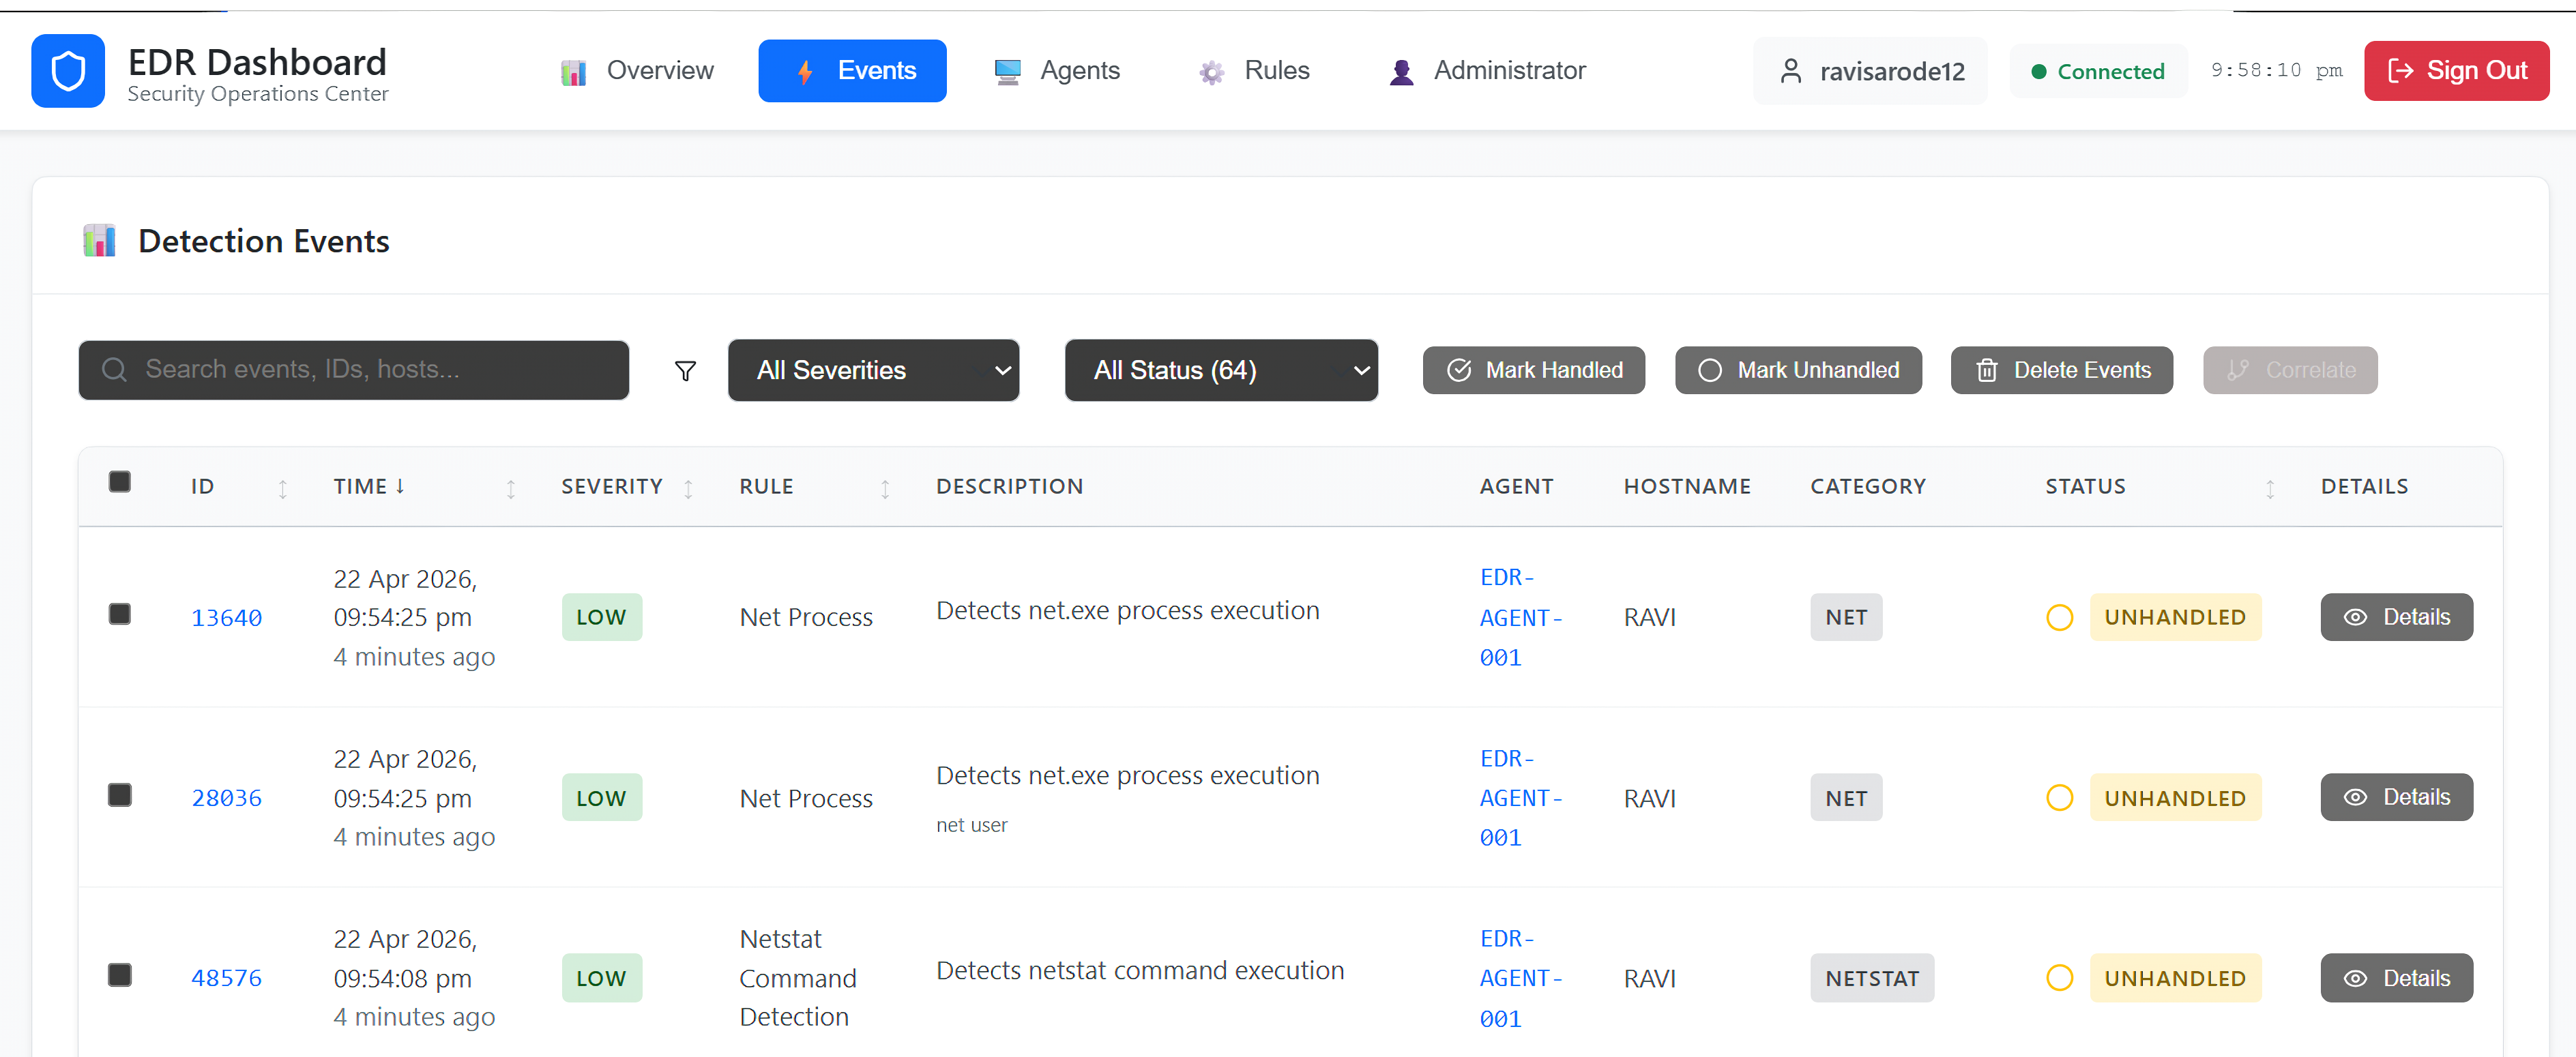
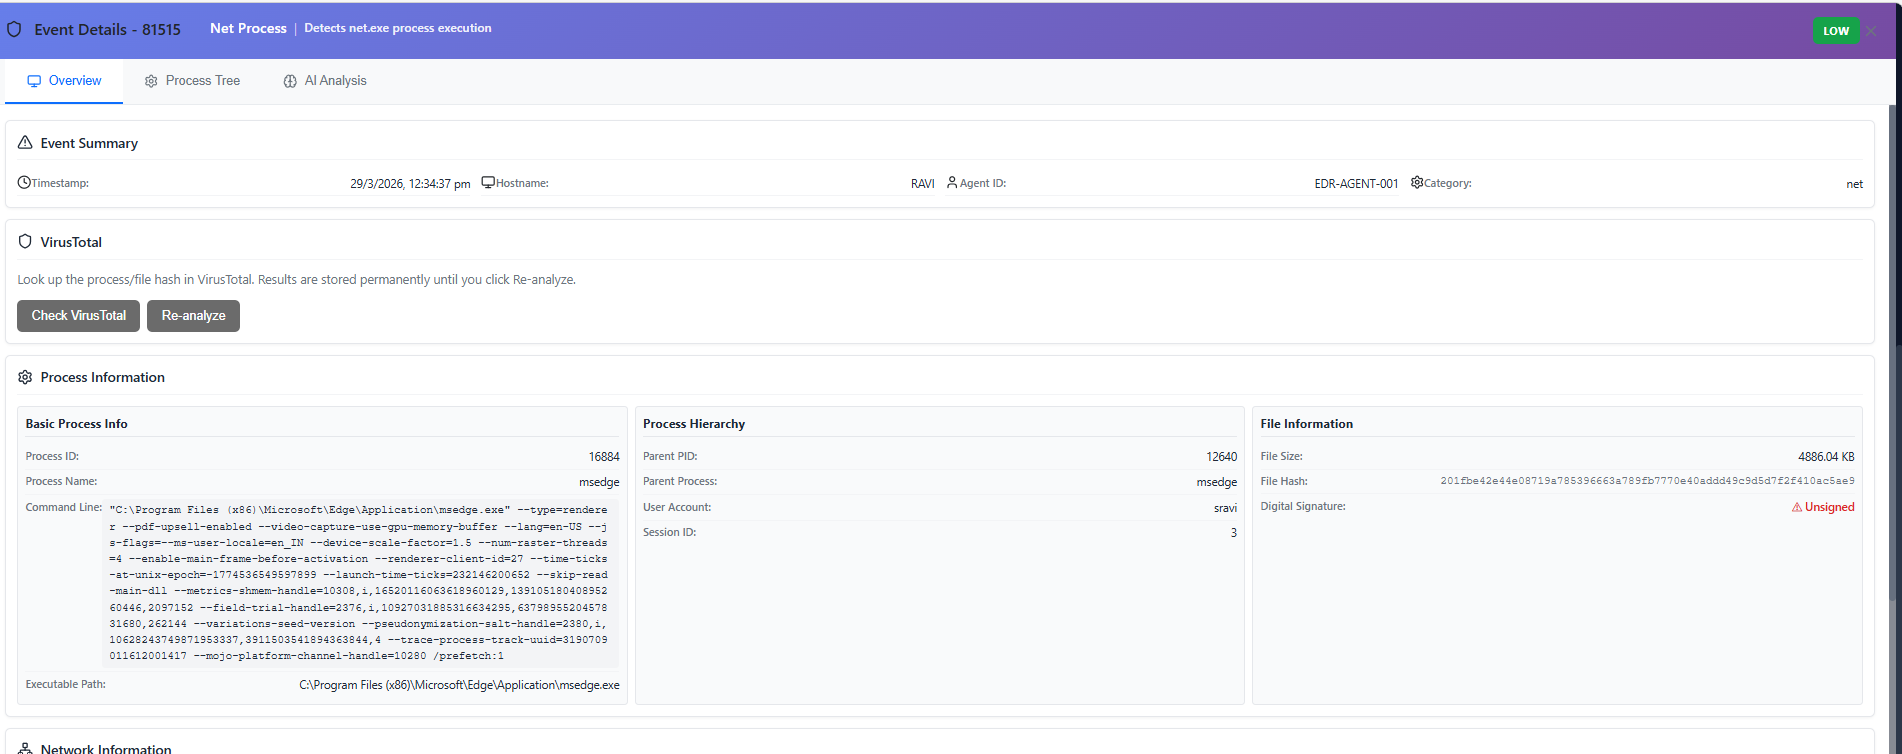
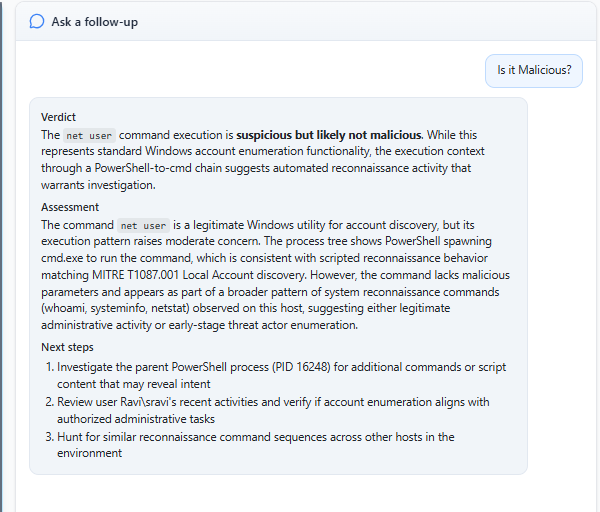
The dashboard experience is designed to move from access to investigation quickly:
- Analysts authenticate into a single operations console
- Overview cards summarize current detection pressure and fleet health
- Event detail pages expose process, file, hash, network, and system context
- Follow-up actions such as enrichment, IOC extraction, re-analysis, correlation, and chat stay close to the alert
What analysts should be able to do
- Sort alerts by severity, status, host, or rule
- Open a correlated timeline of related events
- Inspect command lines, hashes, DNS activity, and network context
- Read the AI-generated explanation beside the original evidence
- Ask event-specific follow-up questions using the selected alert context
- Extract IOCs from event evidence when the fields support it
- Select related alerts and request a broader incident-level correlation summary
- Mark alerts as handled, escalated, or still under review
- Review rule metadata that caused the alert
Why this matters
Traditional EDR screens often stop at event listing. This console is meant to show the added investigation layer: evidence remains visible, but the system also explains why the event matters, how it may connect to nearby alerts, and what the analyst can ask next.
For portfolio review, this page should make three things clear:
- The project is not just a detector; it is an end-to-end workflow from endpoint to analyst decision.
- The AI is grounded in collected event evidence and retrieval context, not used as a detached chatbot.
- Administrative controls, rule management, and audit views make the system feel like a deployable security platform.
Suggested alert detail layout
| Section | Purpose |
|---|---|
| Header | Severity, rule, host, and status |
| Summary | Short AI narrative for triage |
| Evidence | Key telemetry that supports the finding |
| Timeline | Ordered sequence of related events |
| Process tree | Parent-child relationships |
| AI chat | Follow-up questions scoped to the selected alert |
| IOCs | Extracted domains, IPs, hashes, file paths, and commands |
| Correlation | Multi-alert story, campaign assessment, and combined risk |
| Metadata | Agent version, timestamps, identifiers, technique mappings |
Rule management behavior
- Show rule name, ID, version, status, and severity
- Organize rules by MITRE-aligned category
- Store logic and conditions in JSON so agent-side rule execution remains predictable
- Allow rule edits to be saved centrally and synchronized to the deployed fleet
- Keep false-positive exclusions separate from detection categories