Architecture
The platform follows a simple operating model: collect endpoint telemetry, detect suspicious behavior, correlate related events, enrich alerts in the cloud, and present the result through the dashboard.
High-level flow
Windows endpoint
  -> Sysmon telemetry
  -> Endpoint agent
  -> API Gateway
  -> Lambda services
  -> DynamoDB and S3
  -> Pinecone retrieval
  -> Bedrock Claude 4 Sonnet analysis
  -> React dashboard
Architecture diagram
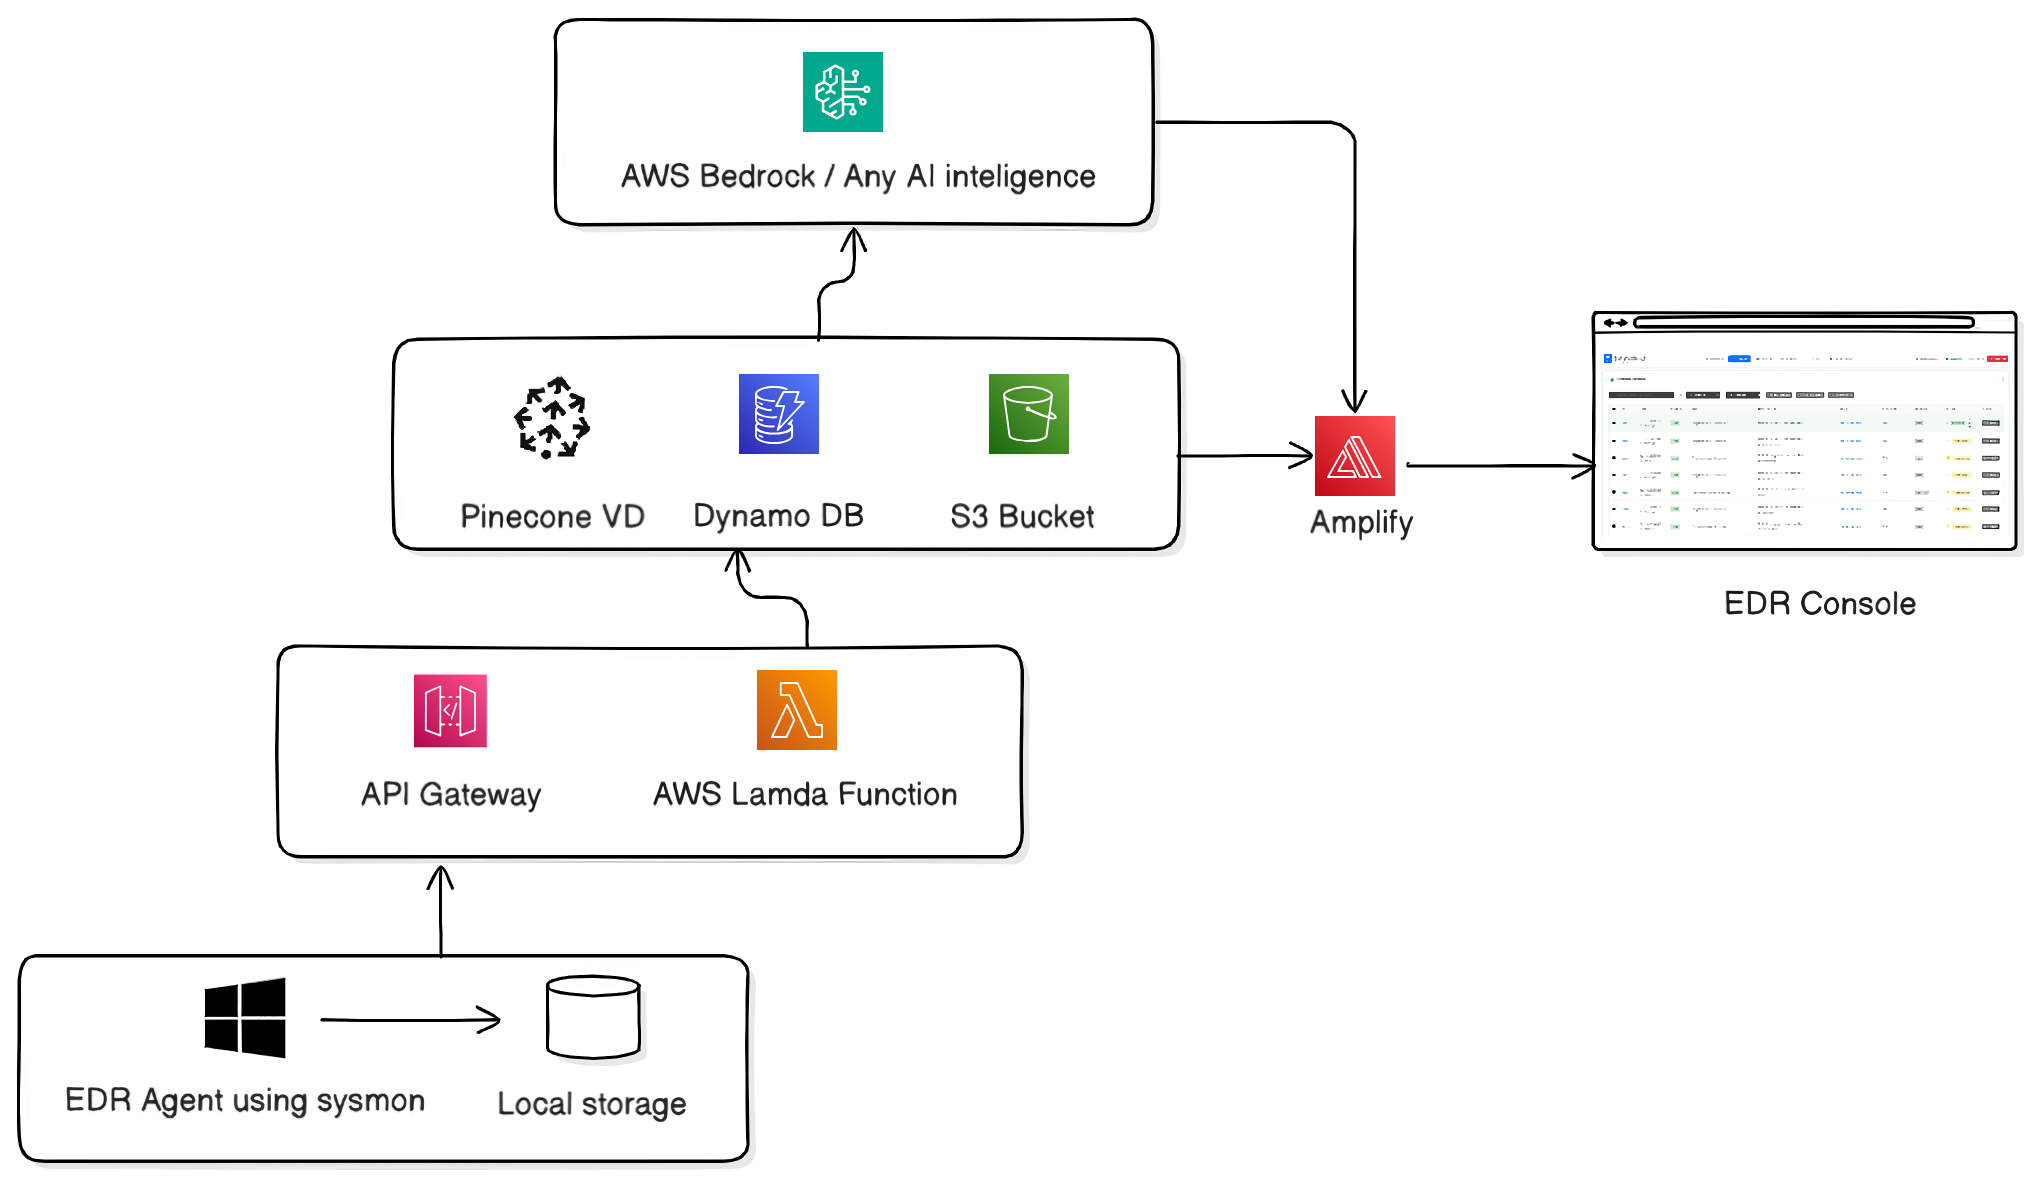
This diagram highlights the product boundaries:
- The Windows agent collects and stages endpoint data
- API Gateway and Lambda handle ingest and processing
- DynamoDB and S3 store investigation data
- Pinecone retrieves MITRE ATT&CK context and similar historical events
- Amazon Bedrock powers the AI layer, using Claude 4 Sonnet in the current implementation
- The EDR console is delivered to analysts through the web interface
Solution overview
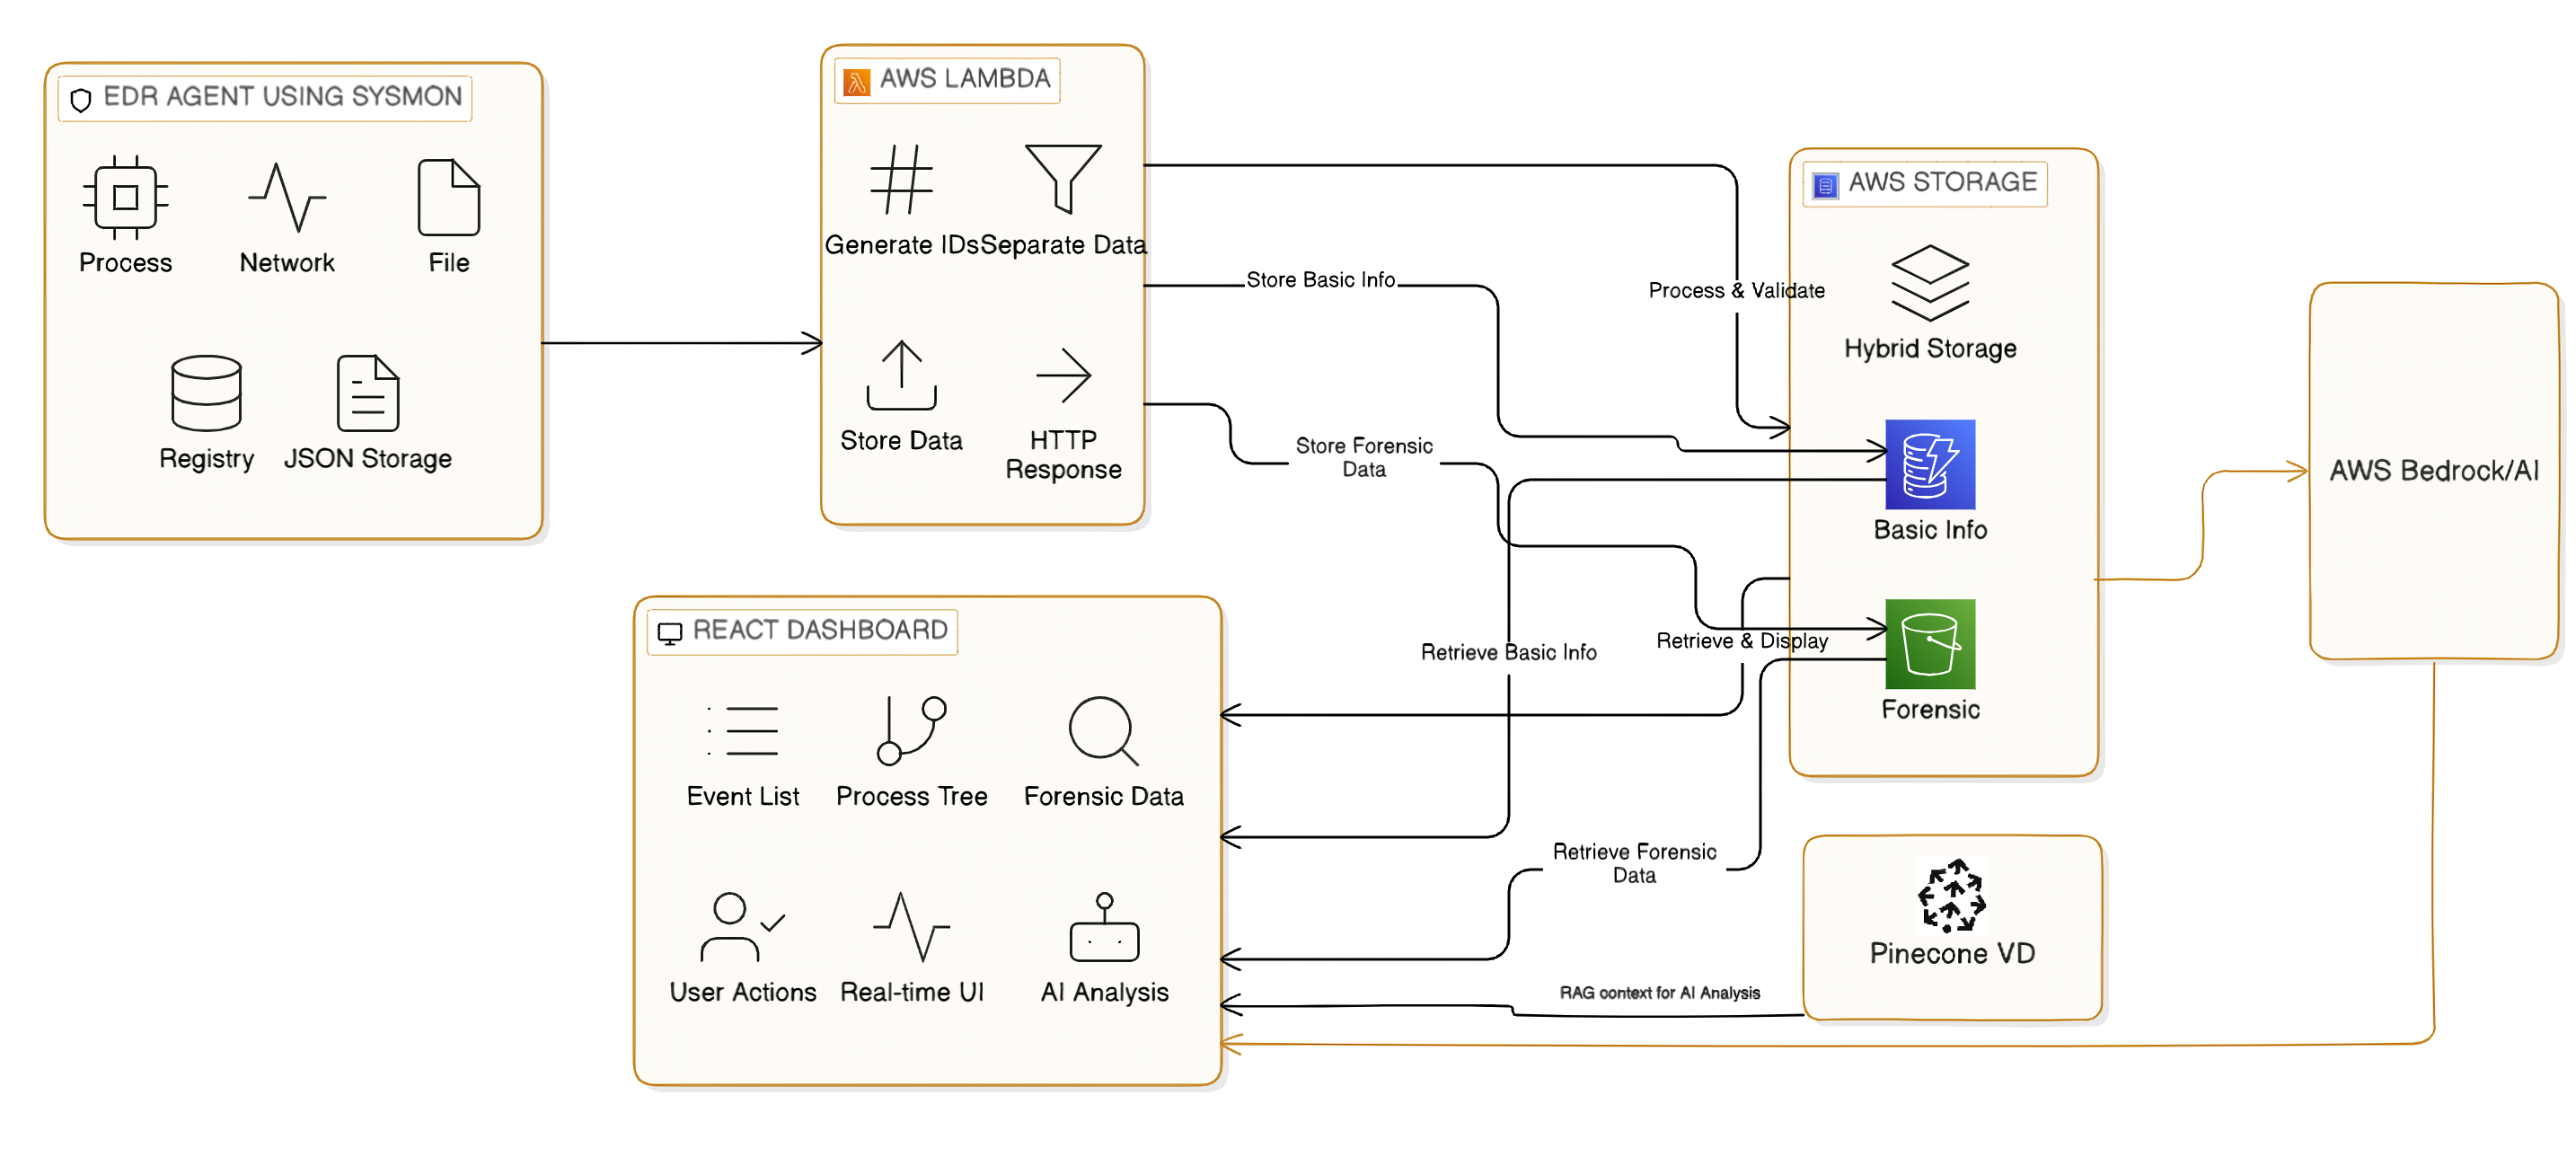
This report view shows the same architecture as an operational flow, starting from endpoint collection and moving through backend processing, retrieval, AI analysis, and dashboard presentation.
Core layers
Endpoint layer
- Captures Windows events from Sysmon
- Normalizes raw event data into a consistent schema
- Applies JSON rules to reduce noise early
- Correlates related events before upload when local context is useful
- Buffers data during network interruptions
Cloud layer
- Accepts telemetry and alerts through API Gateway
- Uses Lambda functions for ingest, query, administration, and AI orchestration
- Stores hot investigation data in DynamoDB
- Stores large payloads, exports, and retrieval content in S3
- Queries Pinecone for similar events and MITRE ATT&CK grounding
- Calls Amazon Bedrock for analysis once sufficient alert context is available
Analyst layer
- Provides a React dashboard for search, triage, and rule operations
- Shows correlated timelines, process trees, and alert metadata
- Surfaces AI-generated summaries alongside the original evidence
- Supports follow-up questions, IOC extraction, and multi-alert investigation workflows
Data flow
- Sysmon emits endpoint events.
- The agent parses and normalizes the event payload.
- Detection rules evaluate the event stream.
- Correlation logic groups related events into a single alert story.
- The backend stores the alert and supporting evidence.
- Pinecone retrieves ATT&CK context and semantically similar historical events.
- AI analysis produces an explanation grounded in event data and retrieval context.
- The dashboard presents summaries, follow-up chat, IOC extraction, and correlation output to the analyst.