Web console — how it works
Production URL: console.ravisarode.com (configure your deployment’s API base URL in dashboard/src/services/api.ts).
After login (Amplify/Cognito), the app shows a single Dashboard with a top navigation bar—no separate URL routes per tab; state is in React (activeTab).
Sign-in
Use your Cognito credentials on the EDR Dashboard login screen.
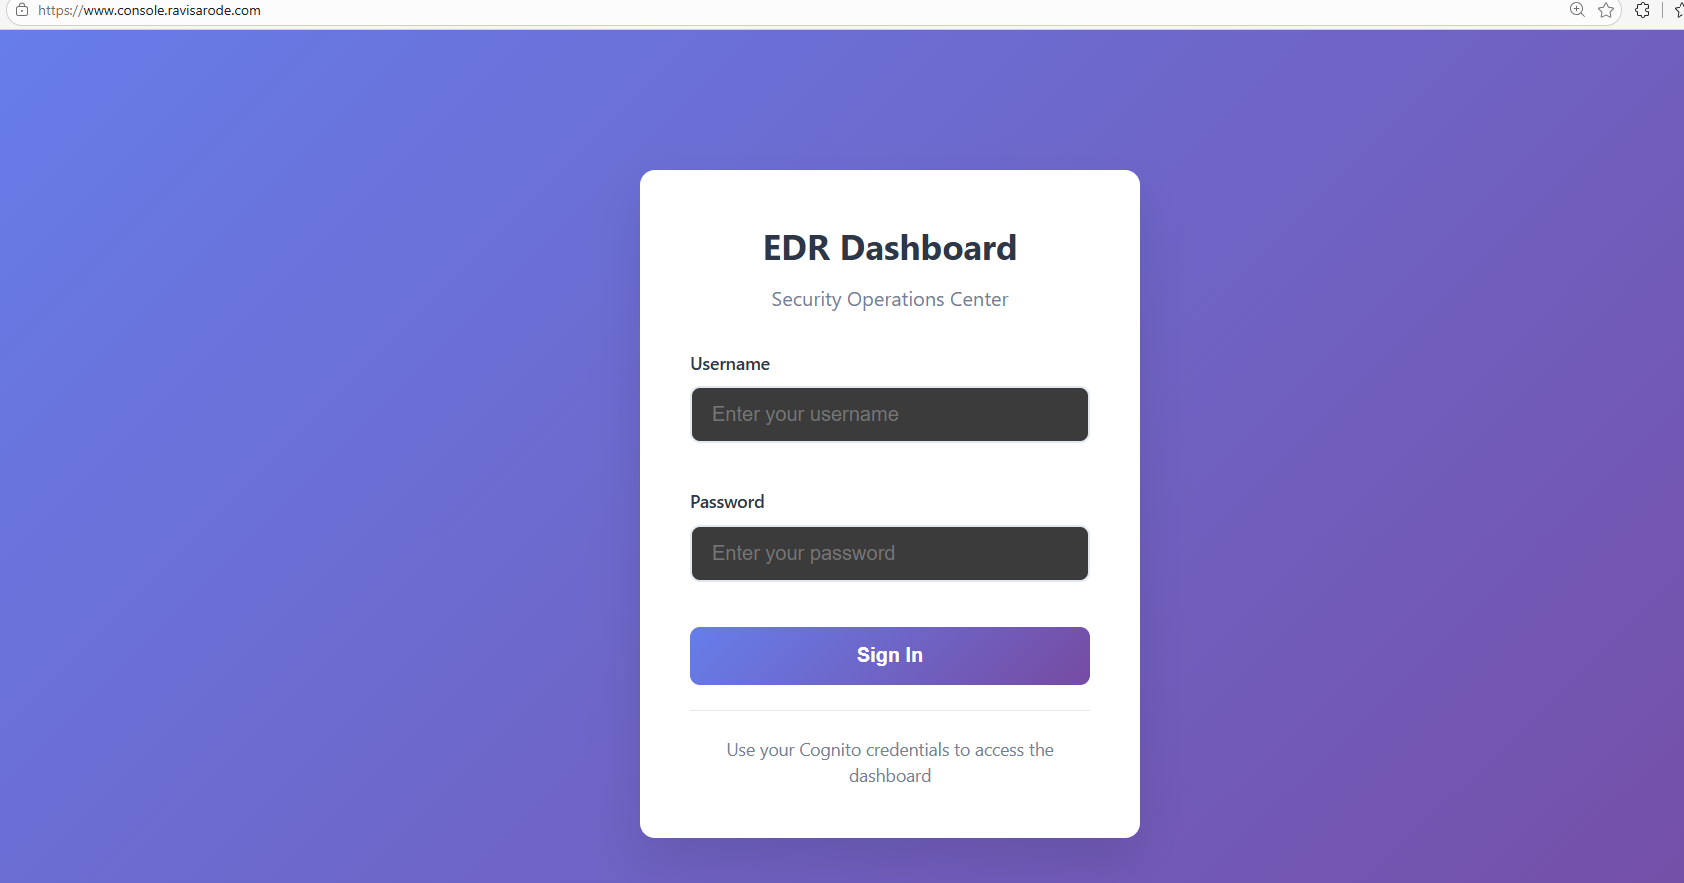
Figure: Email/password sign-in (Amplify/Cognito).
Navigation (Header)
Defined in Header.tsx:
| Tab | Purpose |
|---|---|
| Overview | Live metrics: total events, last 24h, high/critical counts, severity breakdown, unhandled count, quick links. |
| Events | Main triage table for all ingested detections. |
| Agents | Registered endpoints and status. |
| Rules | View/edit JSON rule sets served by the API. |
| Administrator | Users, connections, login activity (sub-sections). |
The header also shows online/offline, current user, and IST clock.
Overview tab
Component: Overview.tsx
- Pulls
getAgentsandgetEventson a refresh interval. - Computes metrics: events in last 24h, high-severity count, active agents, systemStatus (operational / warning / critical from thresholds).
- Shows severity distribution and unhandled event count.
- Cards can navigate to other tabs via
onNavigate.

Figure: Overview — total events, last 24h, high/critical counts, severity breakdown, unhandled count, quick links. Replace placeholder-dashboard-overview.svg with a PNG capture of the Overview tab when available.
Events tab
Component: EventsTable.tsx
Behavior:
- Search across rule name, description, agent id, hostname, unique id.
- Filters: severity, handled vs unhandled.
- Sort by timestamp, severity, rule name, unique id, handled.
- Pagination (e.g. 15 per page).
- Row selection for bulk actions (mark handled, delete—via API).
- Open details opens
EventDetailsModal(fullscreen-style). - Correlation: selecting multiple events can trigger multi-event correlation (RAG-backed analysis when configured)—see API
POST /events/correlateusage in the component.

Figure: Events — triage table with time (IST), rule, severity, description, handled; bulk actions and correlation. Add events.png (or similar) under static/img/screenshots/ and swap this image when ready.
Event details modal
Component: EventDetailsModal.tsx
Opens when you click an event. Three tabs:
1. Overview
- Event summary: timestamp (IST), hostname, agent id, category.
- VirusTotal: if a file hash exists, Check VirusTotal / Re-analyze call
GET /events/{eventId}/virustotal(optional?refresh=true). Shows counts and link to VT. - Process / command / path / hash when present.
- Network and file sections when forensic data exists.
- Handled toggle / status updates may be available (PATCH endpoints per API).
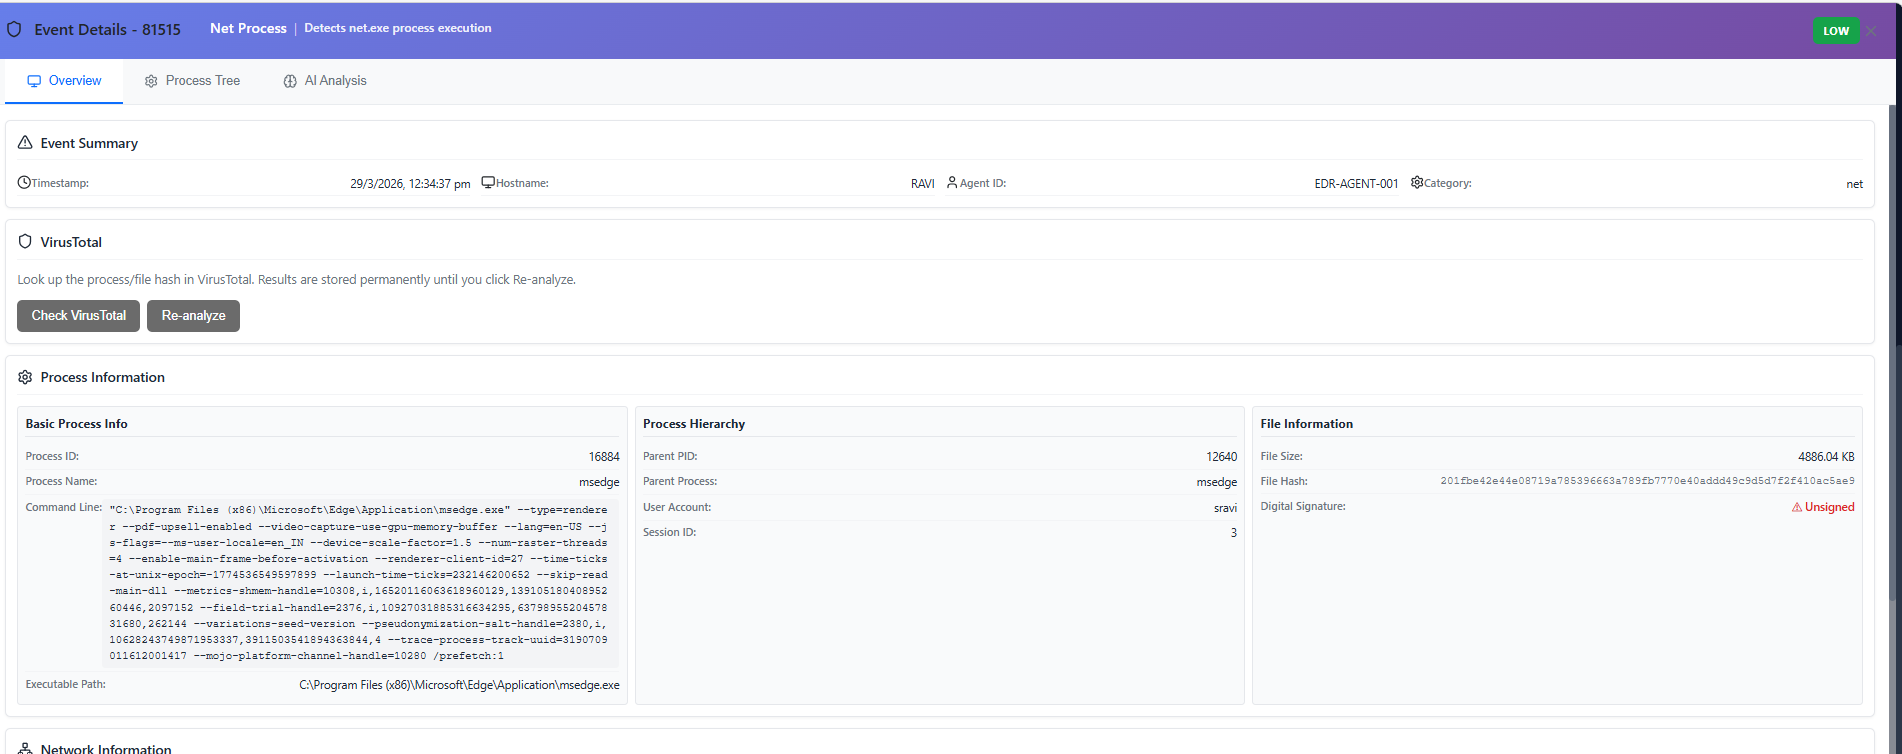
Figure: Overview — event summary, VirusTotal, process/file details, and related fields.
2. Process tree
- Renders the process tree from forensic payload (interactive tree UI).
- Uses merged fields so nodes show command line, hash, etc., when available.
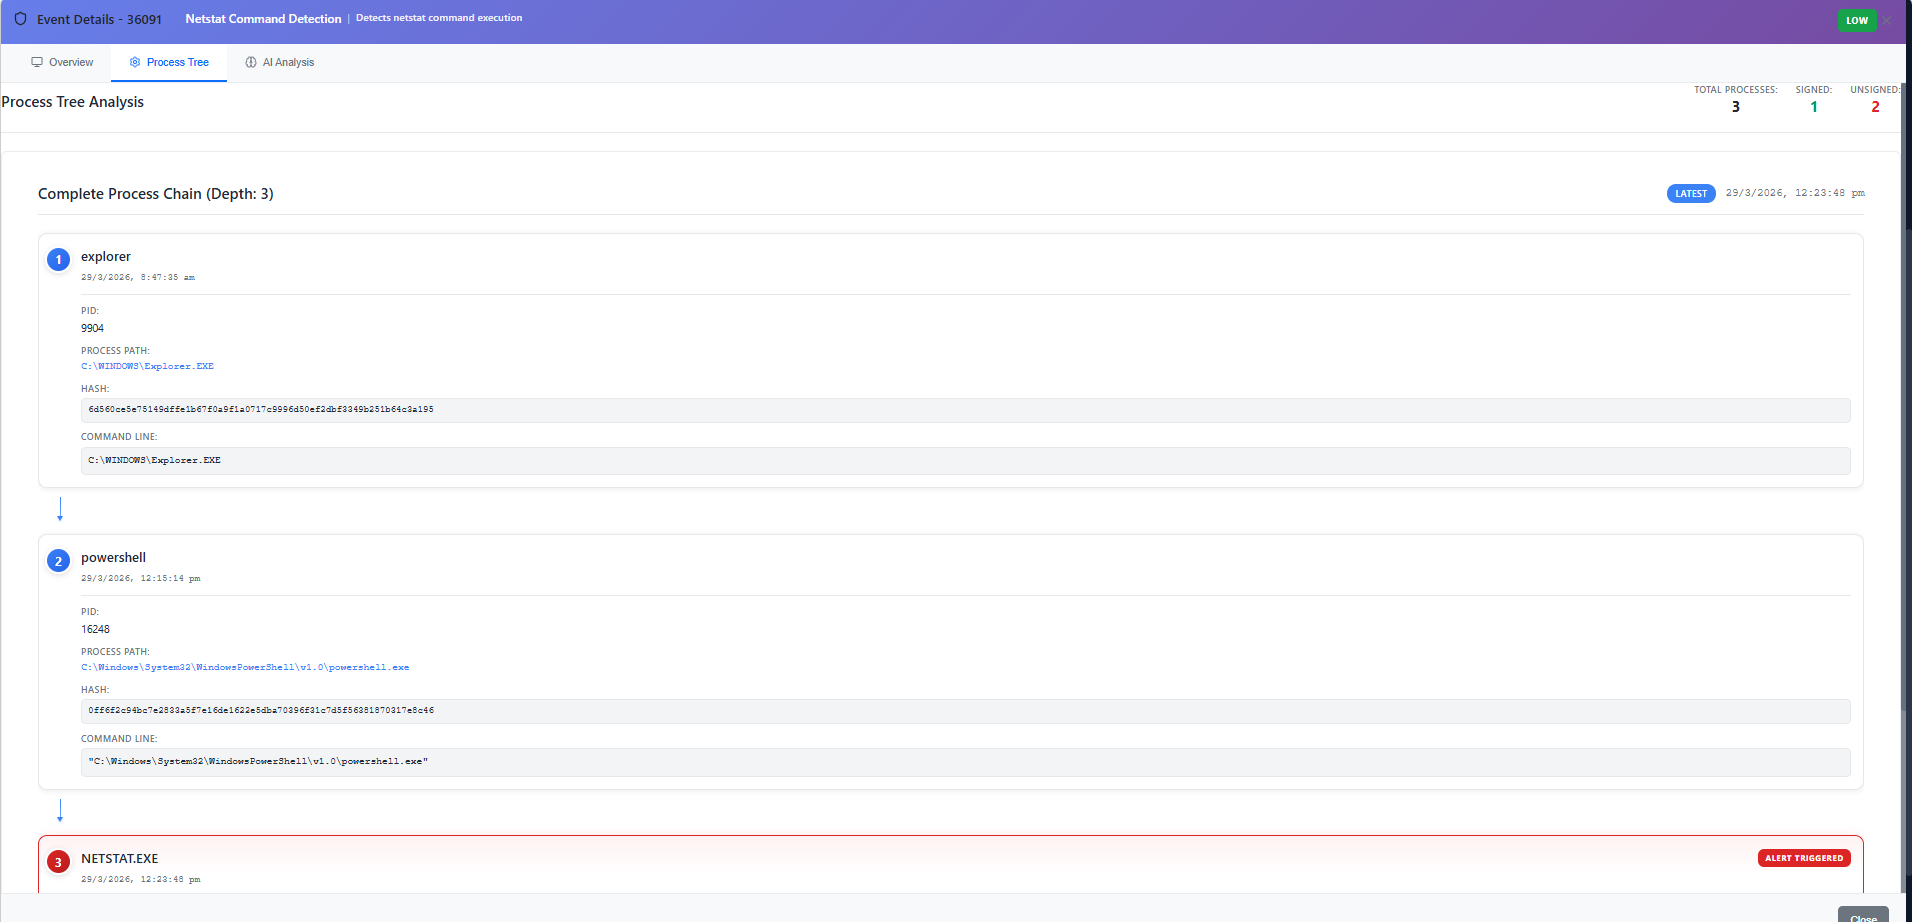
Figure: Process tree — hierarchical process view from forensic payload.
3. AI Analysis
- Run analysis → Bedrock-backed structured analysis (summary, classification, key indicators, MITRE when using non-RAG or RAG pipeline).
- Results cached on the event record.
- Follow-up chat: natural-language Q&A; short questions like “is it suspicious?” use a compact verdict template on the backend (
SYSTEM_PROMPT_AI_CHAT_VERDICT). - Markdown rendering for assistant replies (
MarkdownText).
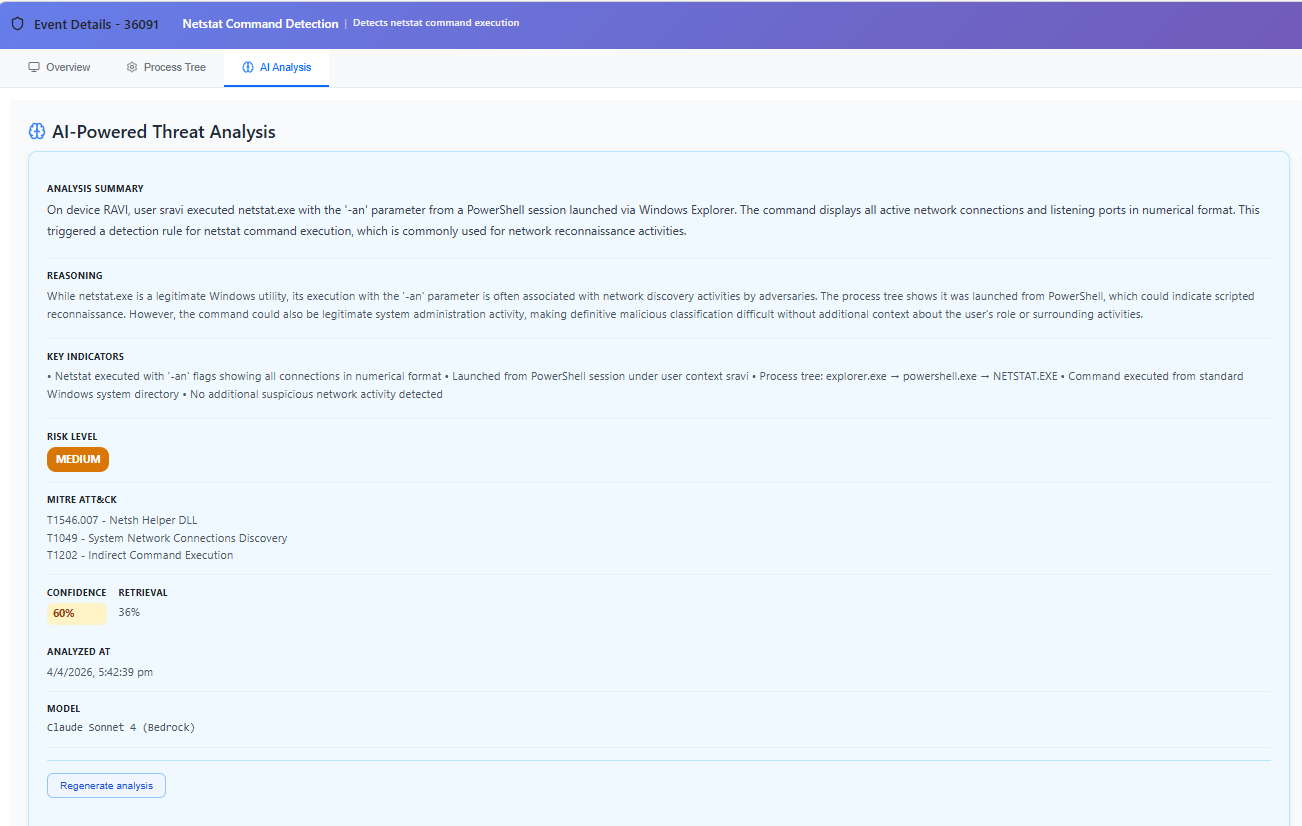
Figure: AI Analysis — run analysis, structured summary, classification, and indicators.
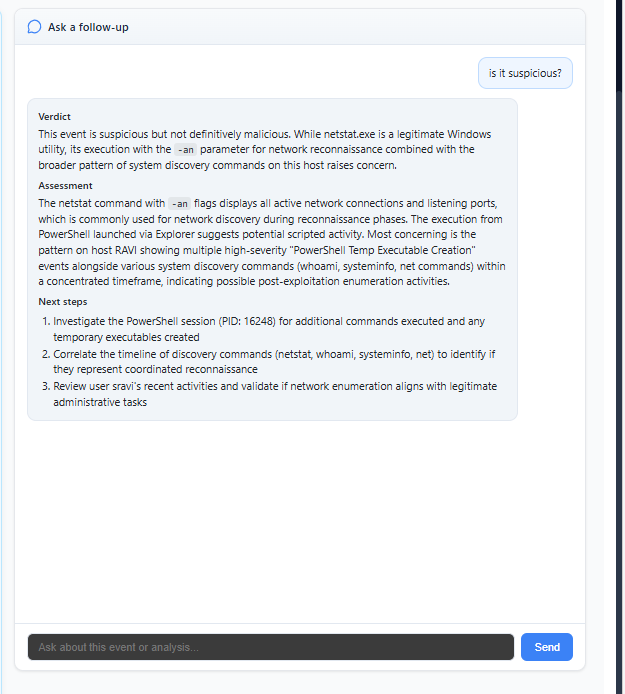
Figure: Follow-up — ask follow-up questions; assistant replies with markdown.
Agents tab
Component: AgentsList.tsx
- Lists agents from
GET /agents: identifiers, hostname, last seen, status. - Refresh button; polling on an interval from parent query.
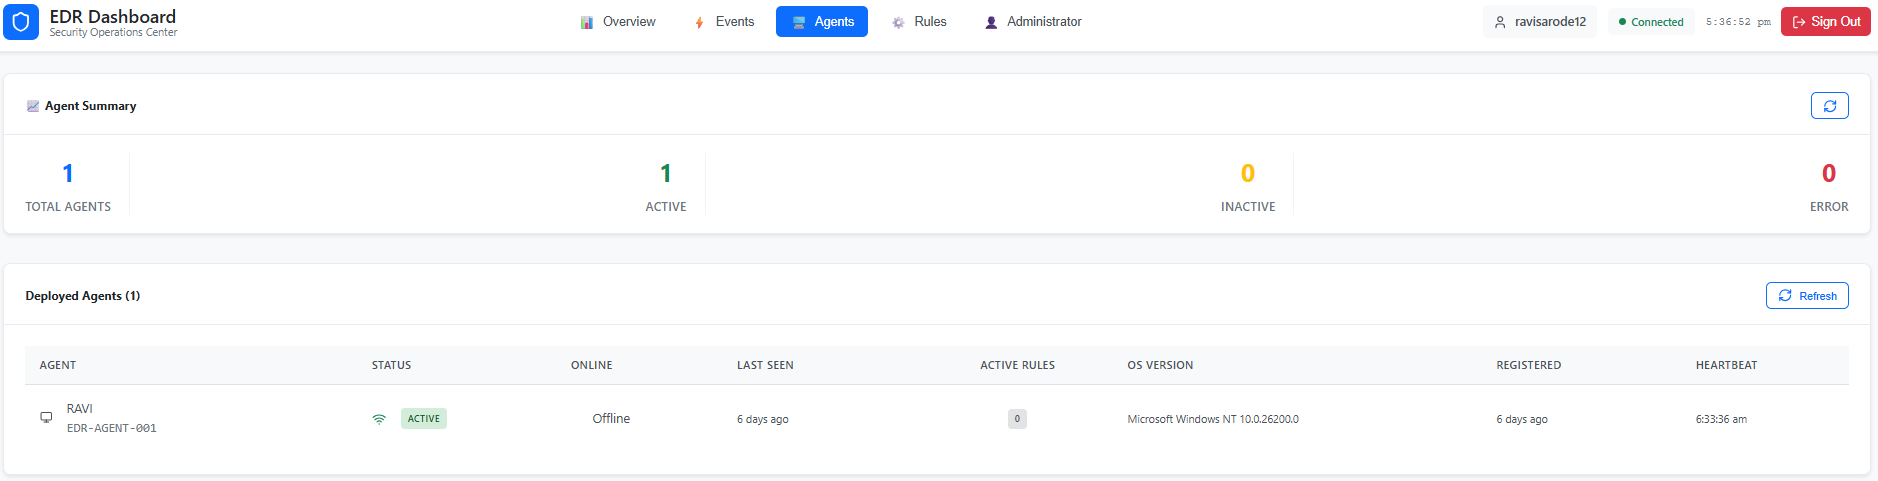
Figure: Agents — registered endpoints, status, last seen, refresh.
Rules tab
Component: RulesManager.tsx
- Fetches
getRuleSets()→ displays rule categories as editable JSON (MITRE-style groupings). - Save pushes updates to the API; refresh reloads.
- Intended for operators who understand JSON rule schema (conditions, logic, operators).
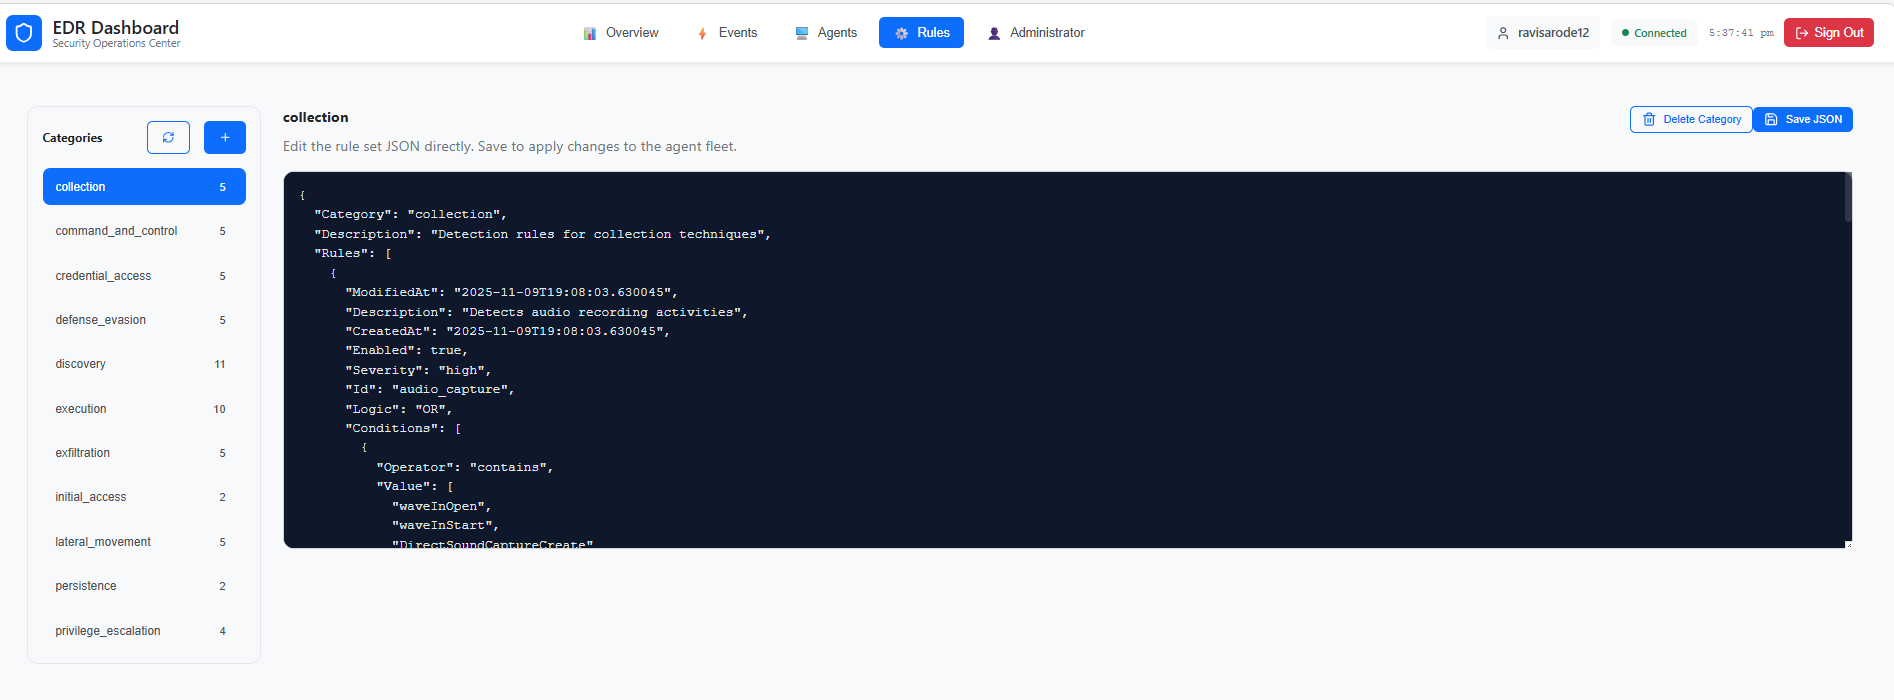
Figure: Rules — categories and JSON editor for rule sets.
Administrator tab
Component: Administrator.tsx
Sidebar sections:
| Section | Behavior |
|---|---|
| Users | UserManagement — dashboard users (Cognito-related). |
| Connections | Connection info (per implementation). |
| Login Activity | loginActivityService.getLoginActivities — filters: date range, activity type, user; summary counts. |
Users

Figure: Users — user accounts, roles, and management actions.
Login Activity
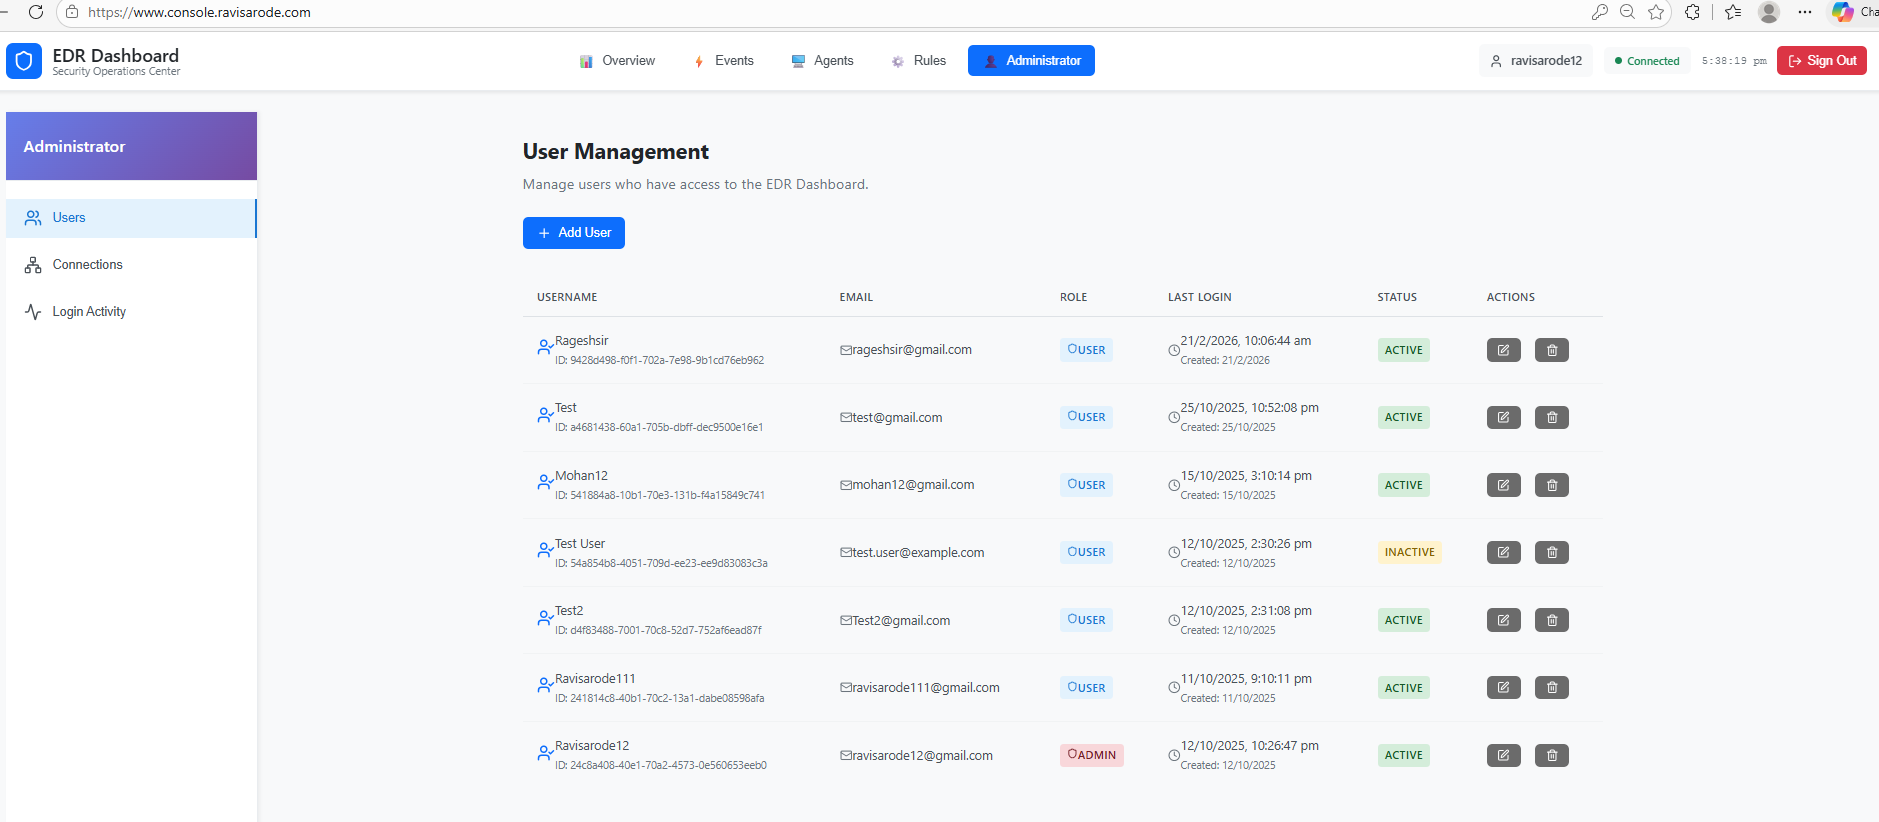
Figure: Login Activity — filters and table of sign-in events.
Screenshot inventory
Files live in documentation/static/img/screenshots/:
| File | Used in this page |
|---|---|
EDR_Dashboard.png | Sign-in |
placeholder-dashboard-overview.svg | Overview (replace with PNG when captured) |
placeholder-dashboard-events.svg | Events (replace with PNG when captured) |
Event_details.png | Event modal → Overview |
Process_Tree.png | Event modal → Process tree |
AI_Analysis.png | Event modal → AI Analysis |
AI_followup_query.png | Event modal → AI follow-up |
Agents.png | Agents |
Rules.png | Rules |
Users.png | Administrator → Users |
Login_activity.png | Administrator → Login Activity |
login panel.png duplicates the sign-in look of EDR_Dashboard.png (same dimensions); the docs use EDR_Dashboard.png for the login figure.